
Getting started
Generate your first dashboard
Generate the dashboard#
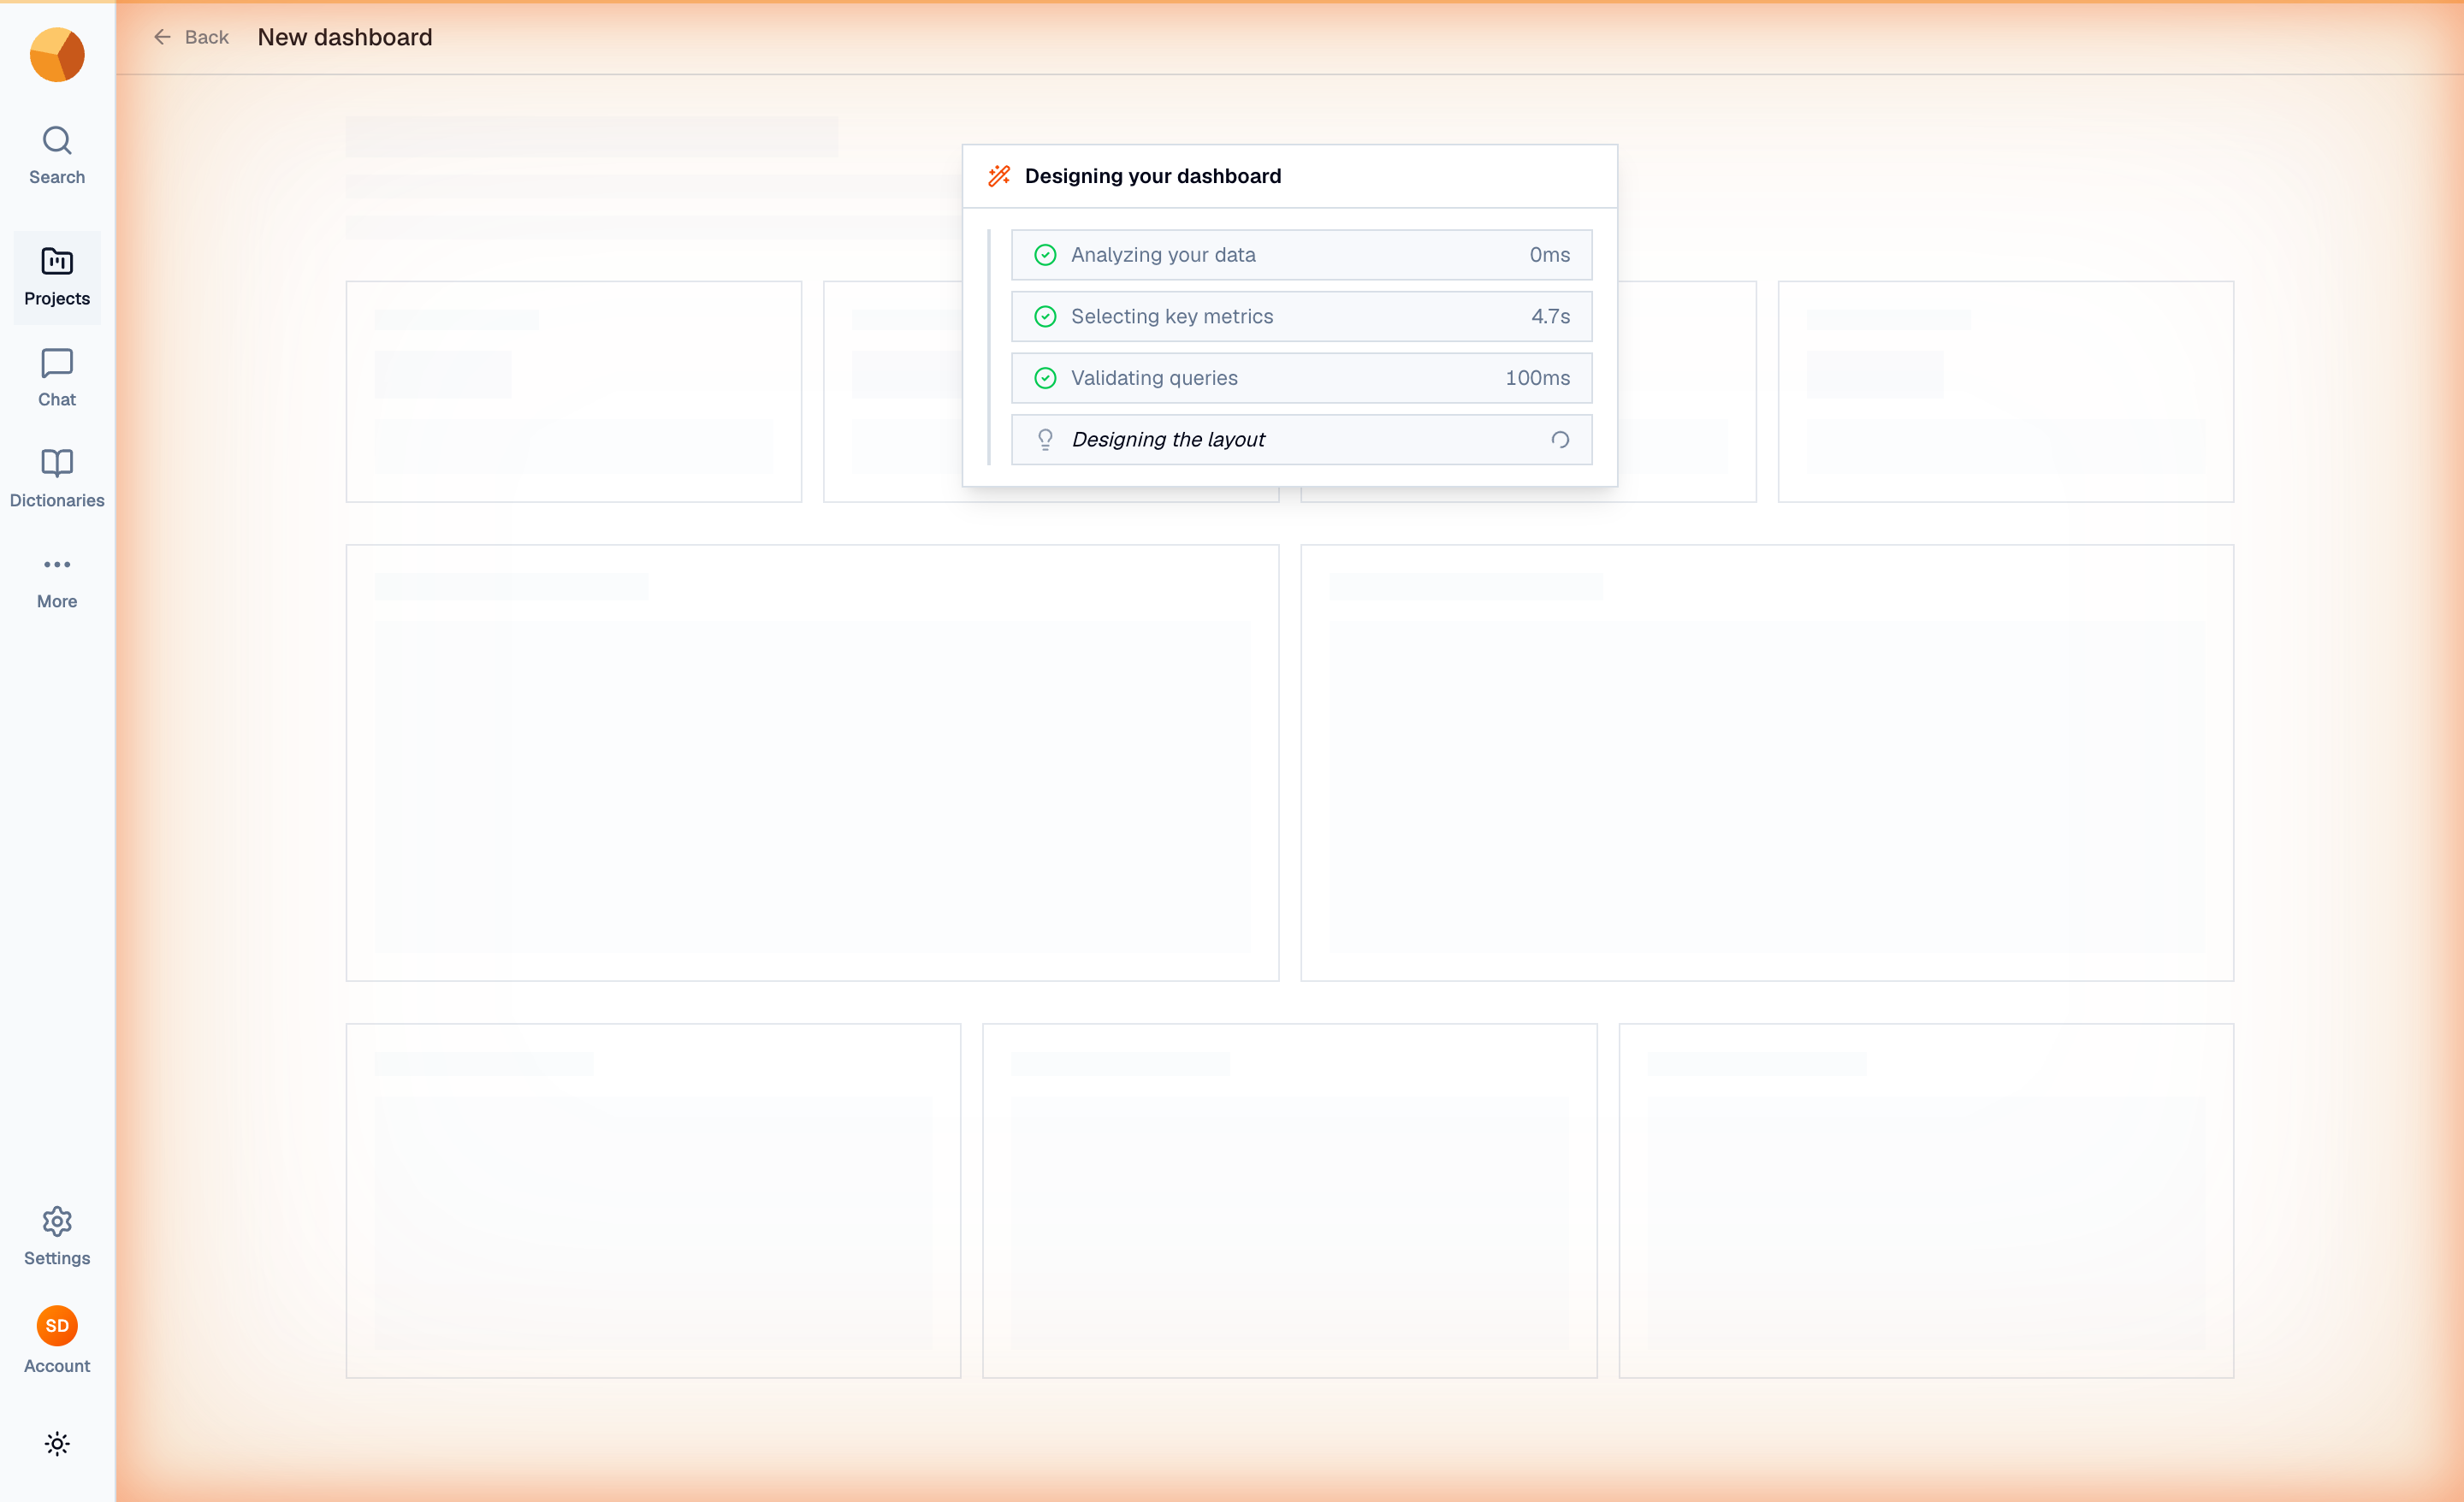
Open the Orders dataset from Upload your first dataset and click Generate dashboard in the right rail. GoPie opens the new dashboard and streams progress in a "Designing your dashboard" card: Analyzing your data, Selecting key metrics, Validating queries, then Designing the layout, each with its timing. Expect seconds to a minute, depending on your data. The same button on a project page opens a multi-dataset wizard instead.
Tour what you get#
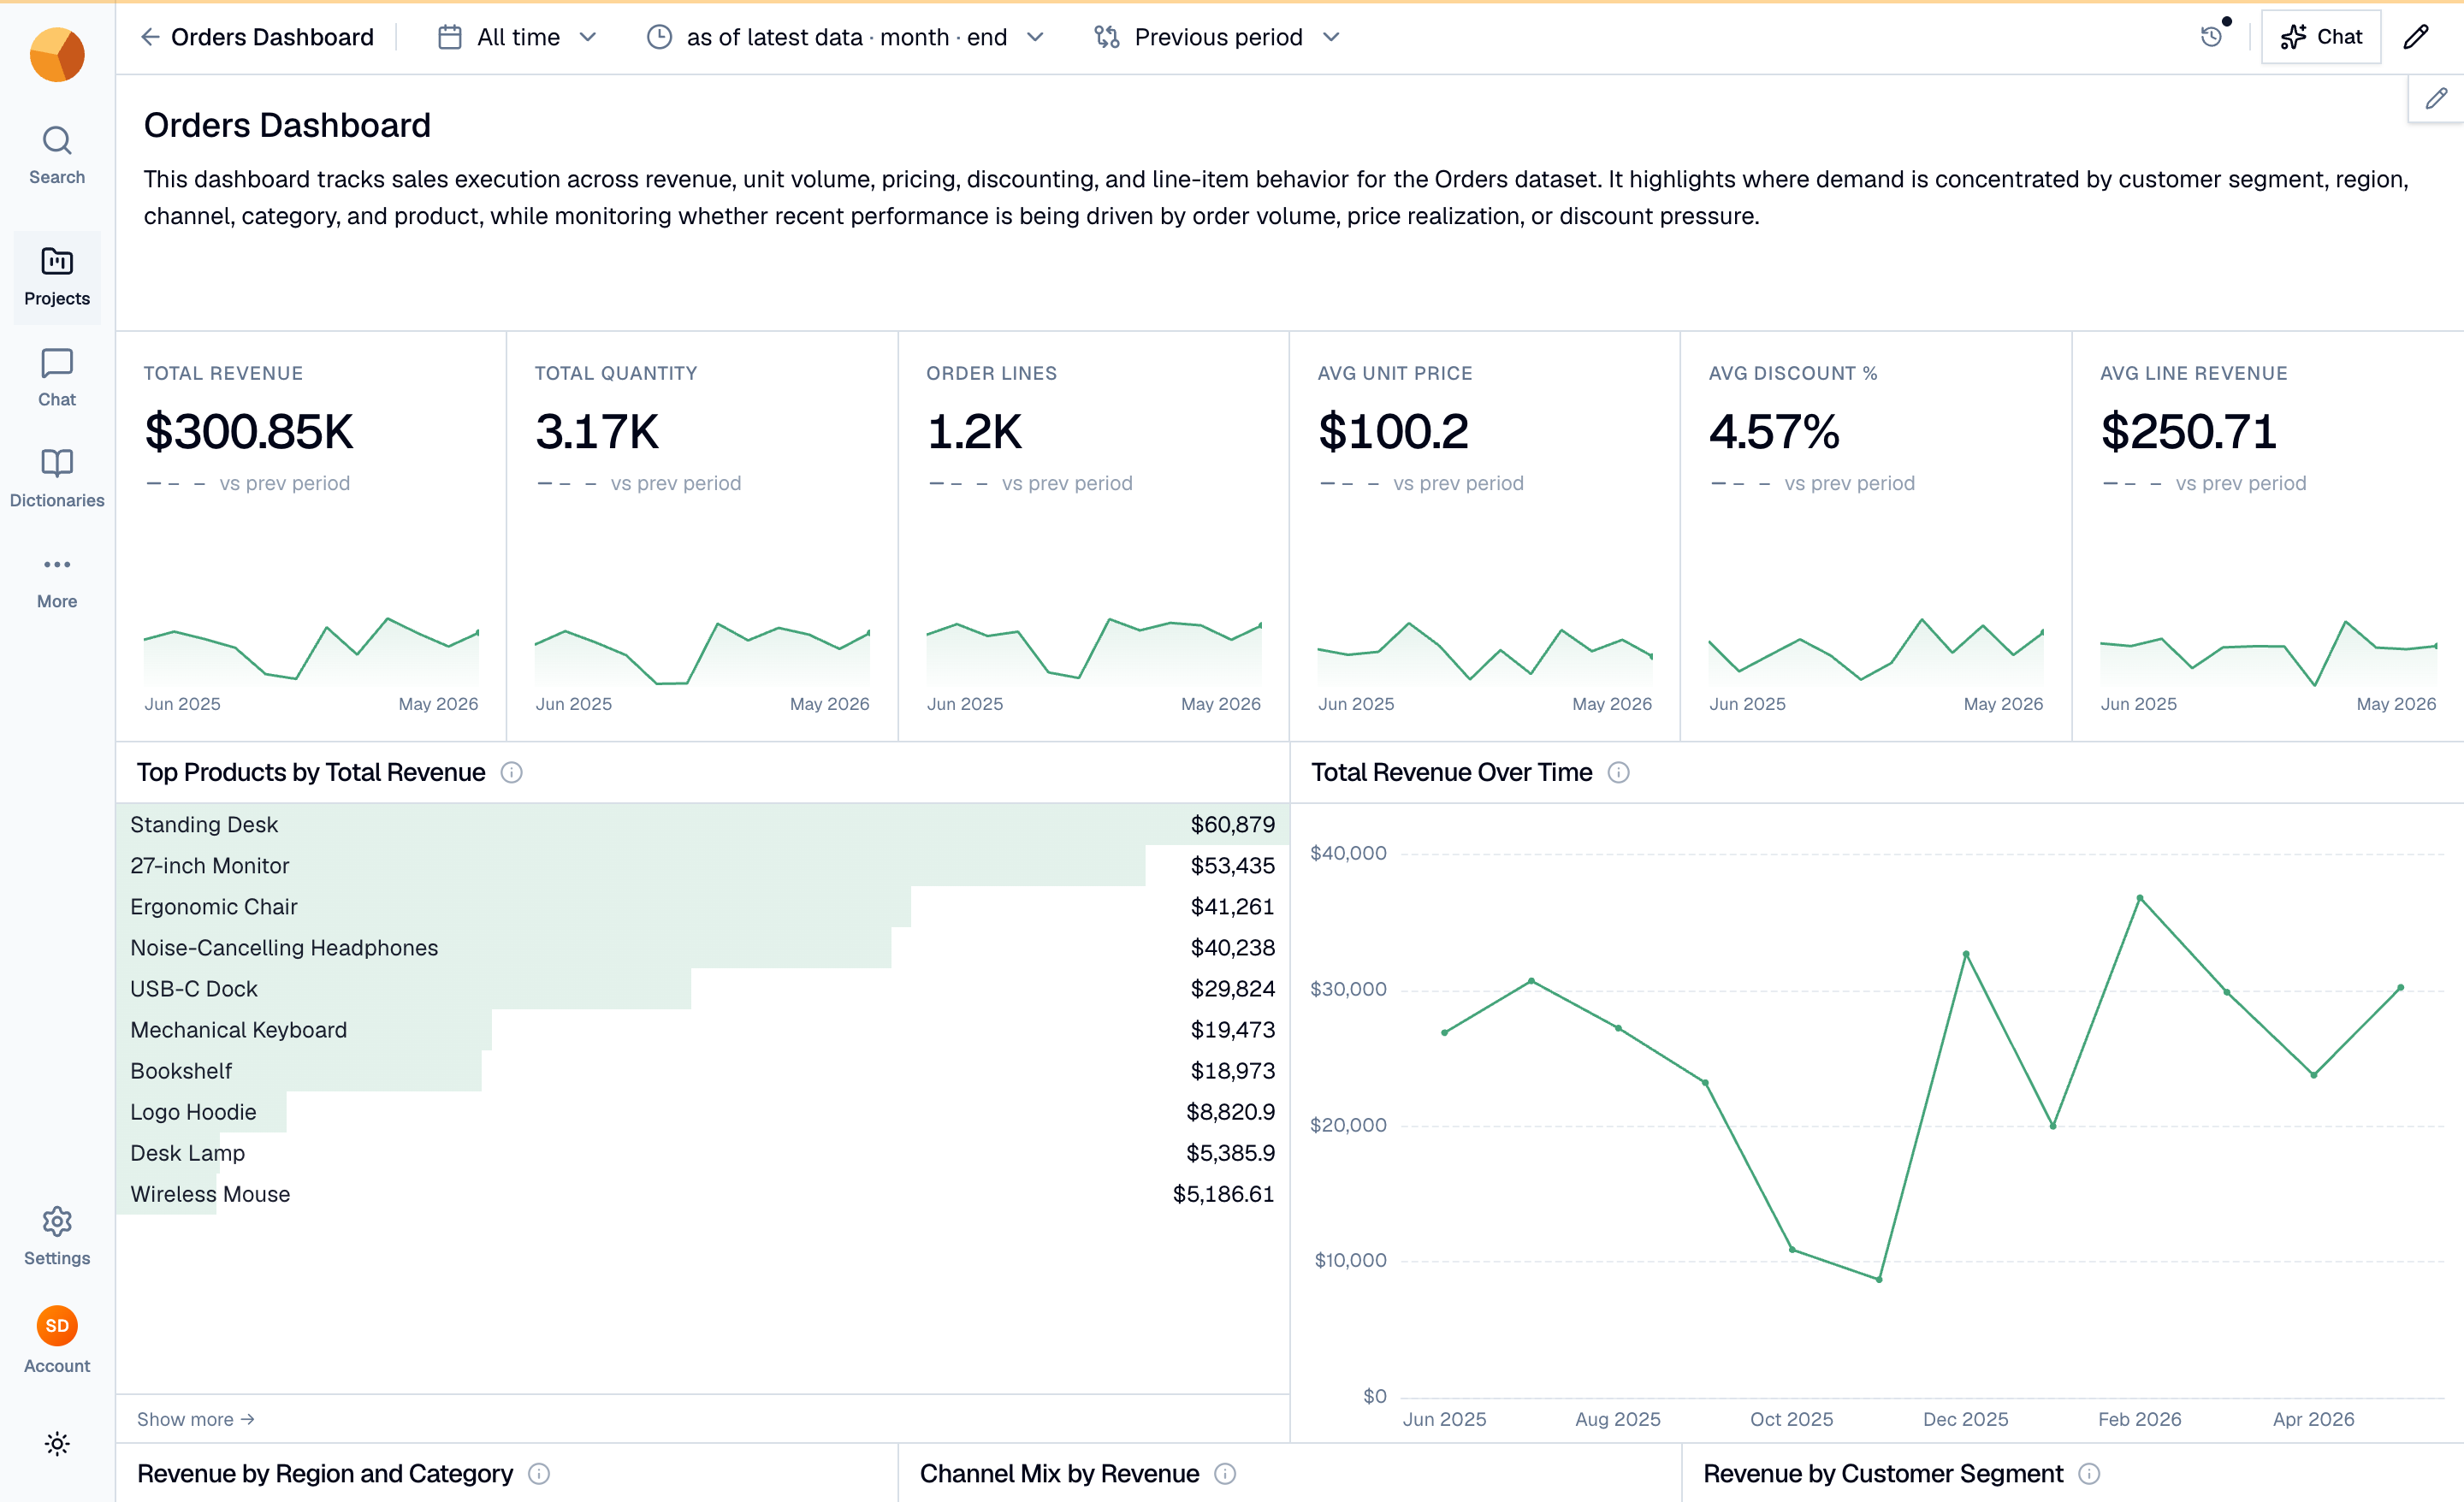
For Orders, the result is a full canvas titled "Orders Dashboard": an AI-written summary, six KPI tiles with sparklines and a vs-previous-period comparison — Total Revenue $300.85K, Avg Discount 4.57% — and charts such as Top Products by Total Revenue, Total Revenue Over Time and Revenue by Customer Segment. Every number is backed by a real SQL query, validated against your dataset during generation: the dashboard is live, not a mockup.
Make it yours#
The toolbar filters the whole canvas: set the time range (All time by default) and a comparison such as Previous period. On any tile, Refine with AI applies a change you describe in plain language, Edit tile adjusts it by hand, or download the tile as CSV or PNG. Press E to rearrange the layout, and open Chat to ask questions about the dashboard — see Editing with dashboard chat. Version history keeps every change restorable.
Tip"Refine with AI" takes requests like "show this as a monthly trend" — describe the outcome and GoPie rewrites the query and chart.
Find it later#
The dashboard saves automatically and appears on the project's Dashboards tab and your home launchpad.
Keep going#
This is the last tutorial in the journey. Continue to AI in GoPie to understand what the AI can do across the platform, or go deep with the Dashboards section — the project wizard, dashboard chat, and version history.