
Dashboards
Dashboards in GoPie
A GoPie dashboard is a live canvas — every tile is backed by a real SQL query that re-runs as you change filters, so what you see is always the current data, never a saved picture. (Need a frozen, citable document instead? That's a report.)
Know the three kinds#
Every dashboard belongs to one owner:
- Dataset dashboards — one per dataset, generated from its page. Single-source.
- View dashboards — one per saved view, the same way. Single-source, and a neat trick: build a view that joins datasets, then dashboard the view.
- Project dashboards — composed through a wizard, spanning multiple datasets and views at once. A project can have any number.
The project's Dashboards tab lists all three in one table, with All / Project / Datasets / Views filter tabs and search. Your home launchpad also lists your recent dashboards.
Tour the canvas#
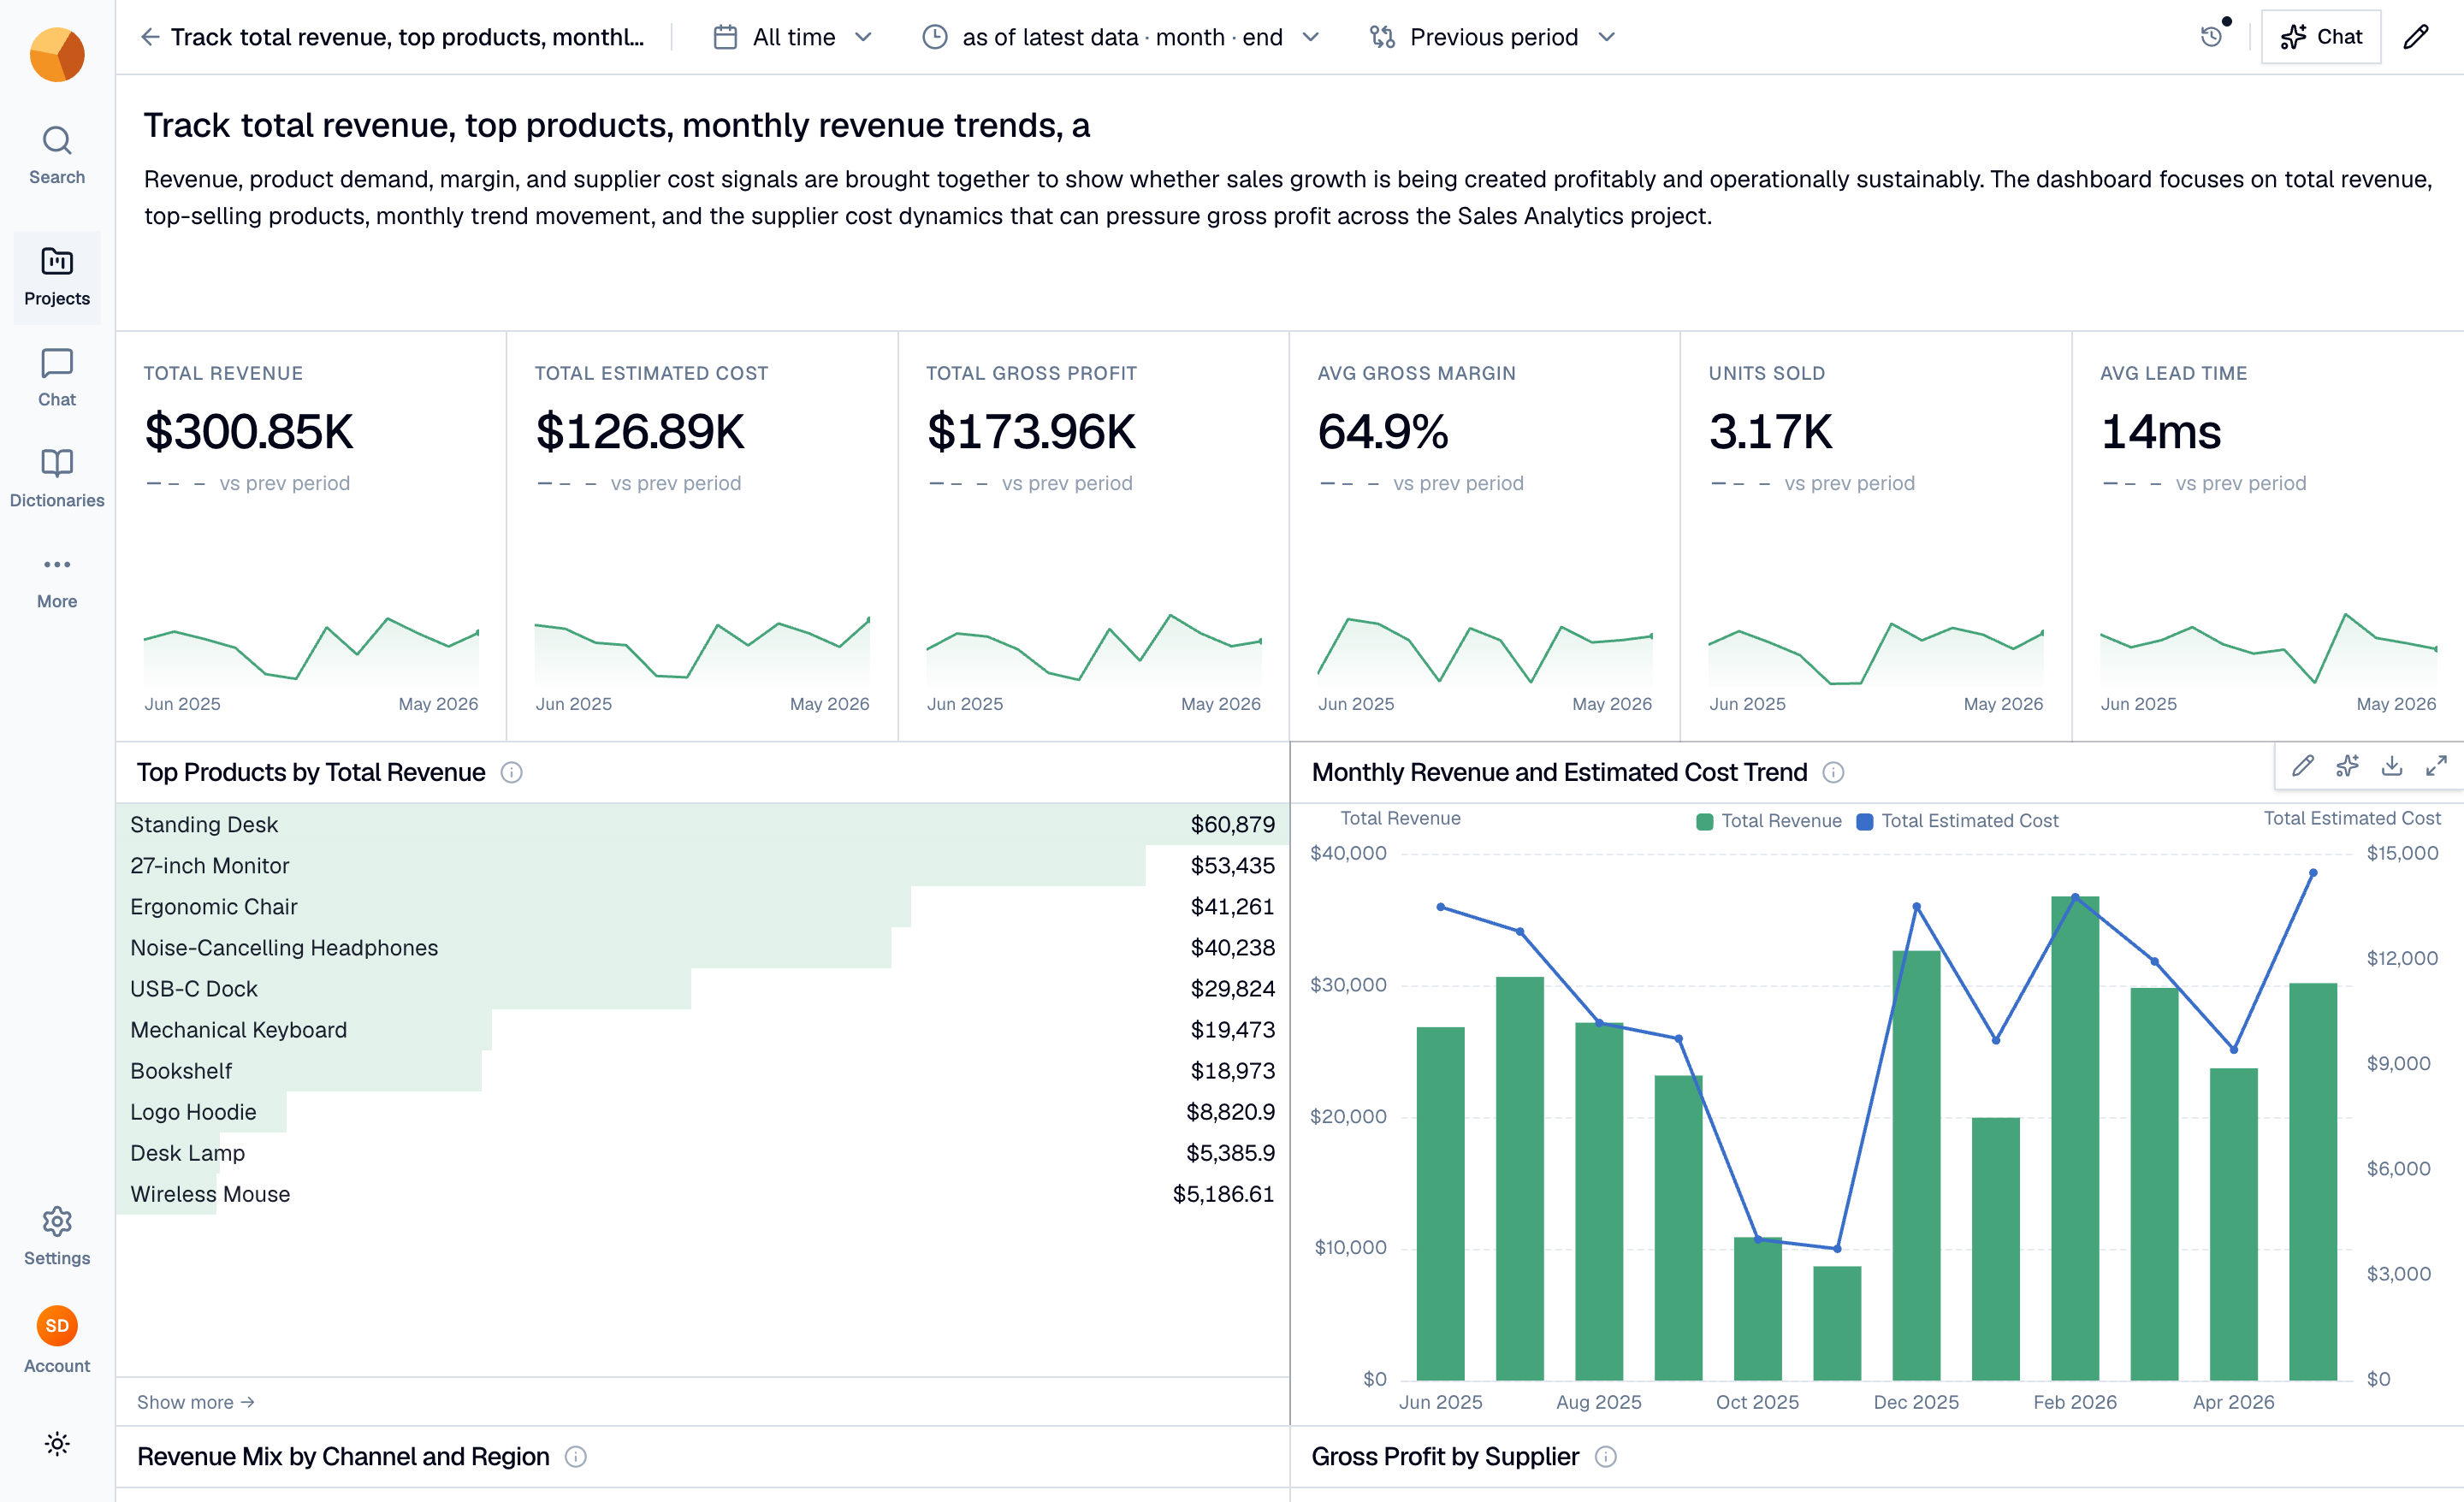
A canvas is rows of tiles, each one of five types:
| Tile | What it shows |
|---|---|
| KPI grid | Headline numbers with sparklines and a vs-previous-period comparison |
| Chart | One of GoPie's chart kinds — line, area, bar, pie, scatter, heatmap, and more |
| Leaderboard | A ranked "top N by measure" list |
| Table | Raw rows for the detail-hungry |
| Text | Markdown — AI-written summaries land here, and your own notes can too |
The toolbar governs the whole canvas at once: a time range (default All time), a comparison mode (such as Previous period), filter pills you can add and remove, and a refresh button that re-runs every query. Since tiles are live queries, a filter change updates every number on the page.
A results dock slides up when dashboard chat produces query results — Hide collapses it to a strip, the × dismisses it.
Edit by hand#
Edit dashboard (the pencil) switches the canvas into edit mode — press Done to leave it:
- Add component creates a new Chart, Table, Text, KPI, or Leaderboard tile.
- Every tile gets an Edit tile control, plus Duplicate and Delete (deleting offers an Undo in the toast).
- Arrange with the move controls (or ⌘ ⇧ + arrow keys), and size tiles with the width stepper (a 12-column grid).
For everything beyond arrangement — changing what a tile shows — describe it to dashboard chat instead: "make this a monthly trend", "add a tile for returns by region". Every change, manual or AI, lands in version history.
Know who can edit#
Organisation owners and admins can edit any dashboard; members can edit dashboards they created. Viewing follows access to the dashboard's source data. Editing controls simply don't appear when you lack the permission — the full model is in Roles & permissions.
Know what doesn't exist (yet)#
- No public sharing or share links — dashboards are visible inside your organisation only.
- No image or PDF export of the canvas. Individual tiles can be downloaded as CSV or PNG from their menus; for a portable document, generate a report.
- No full-screen or presentation mode for the canvas as a whole — individual chart tiles do have a Fullscreen expand.