
Dashboards
AI dashboard generation
GoPie designs dashboards for you: it profiles the data, proposes the metrics that matter, validates every query against your actual schema, and lays out the canvas. Nothing lands on the dashboard that didn't execute.
Generate from a dataset or view#
Click Generate dashboard on a dataset or view page. GoPie opens the dashboard and streams its progress phase by phase, each with its timing:
- Analyzing your data
- Selecting key metrics
- Validating queries
- Designing the layout
- Finalizing your dashboard
Expect seconds to a minute. The result is the full canvas from the introduction — KPI tiles, charts, and an AI-written summary. The walkthrough with a real dataset is in Generate your first dashboard.
NoteIf the AI layout step can't produce a valid canvas, GoPie falls back to a deterministic design built from the dataset's profile — you still get a working dashboard, just a plainer one. Metrics that fail validation are replaced the same way, so every tile always runs.
Compose a project dashboard#
Generate from project (on the Dashboards tab) opens a four-step wizard for multi-dataset dashboards:
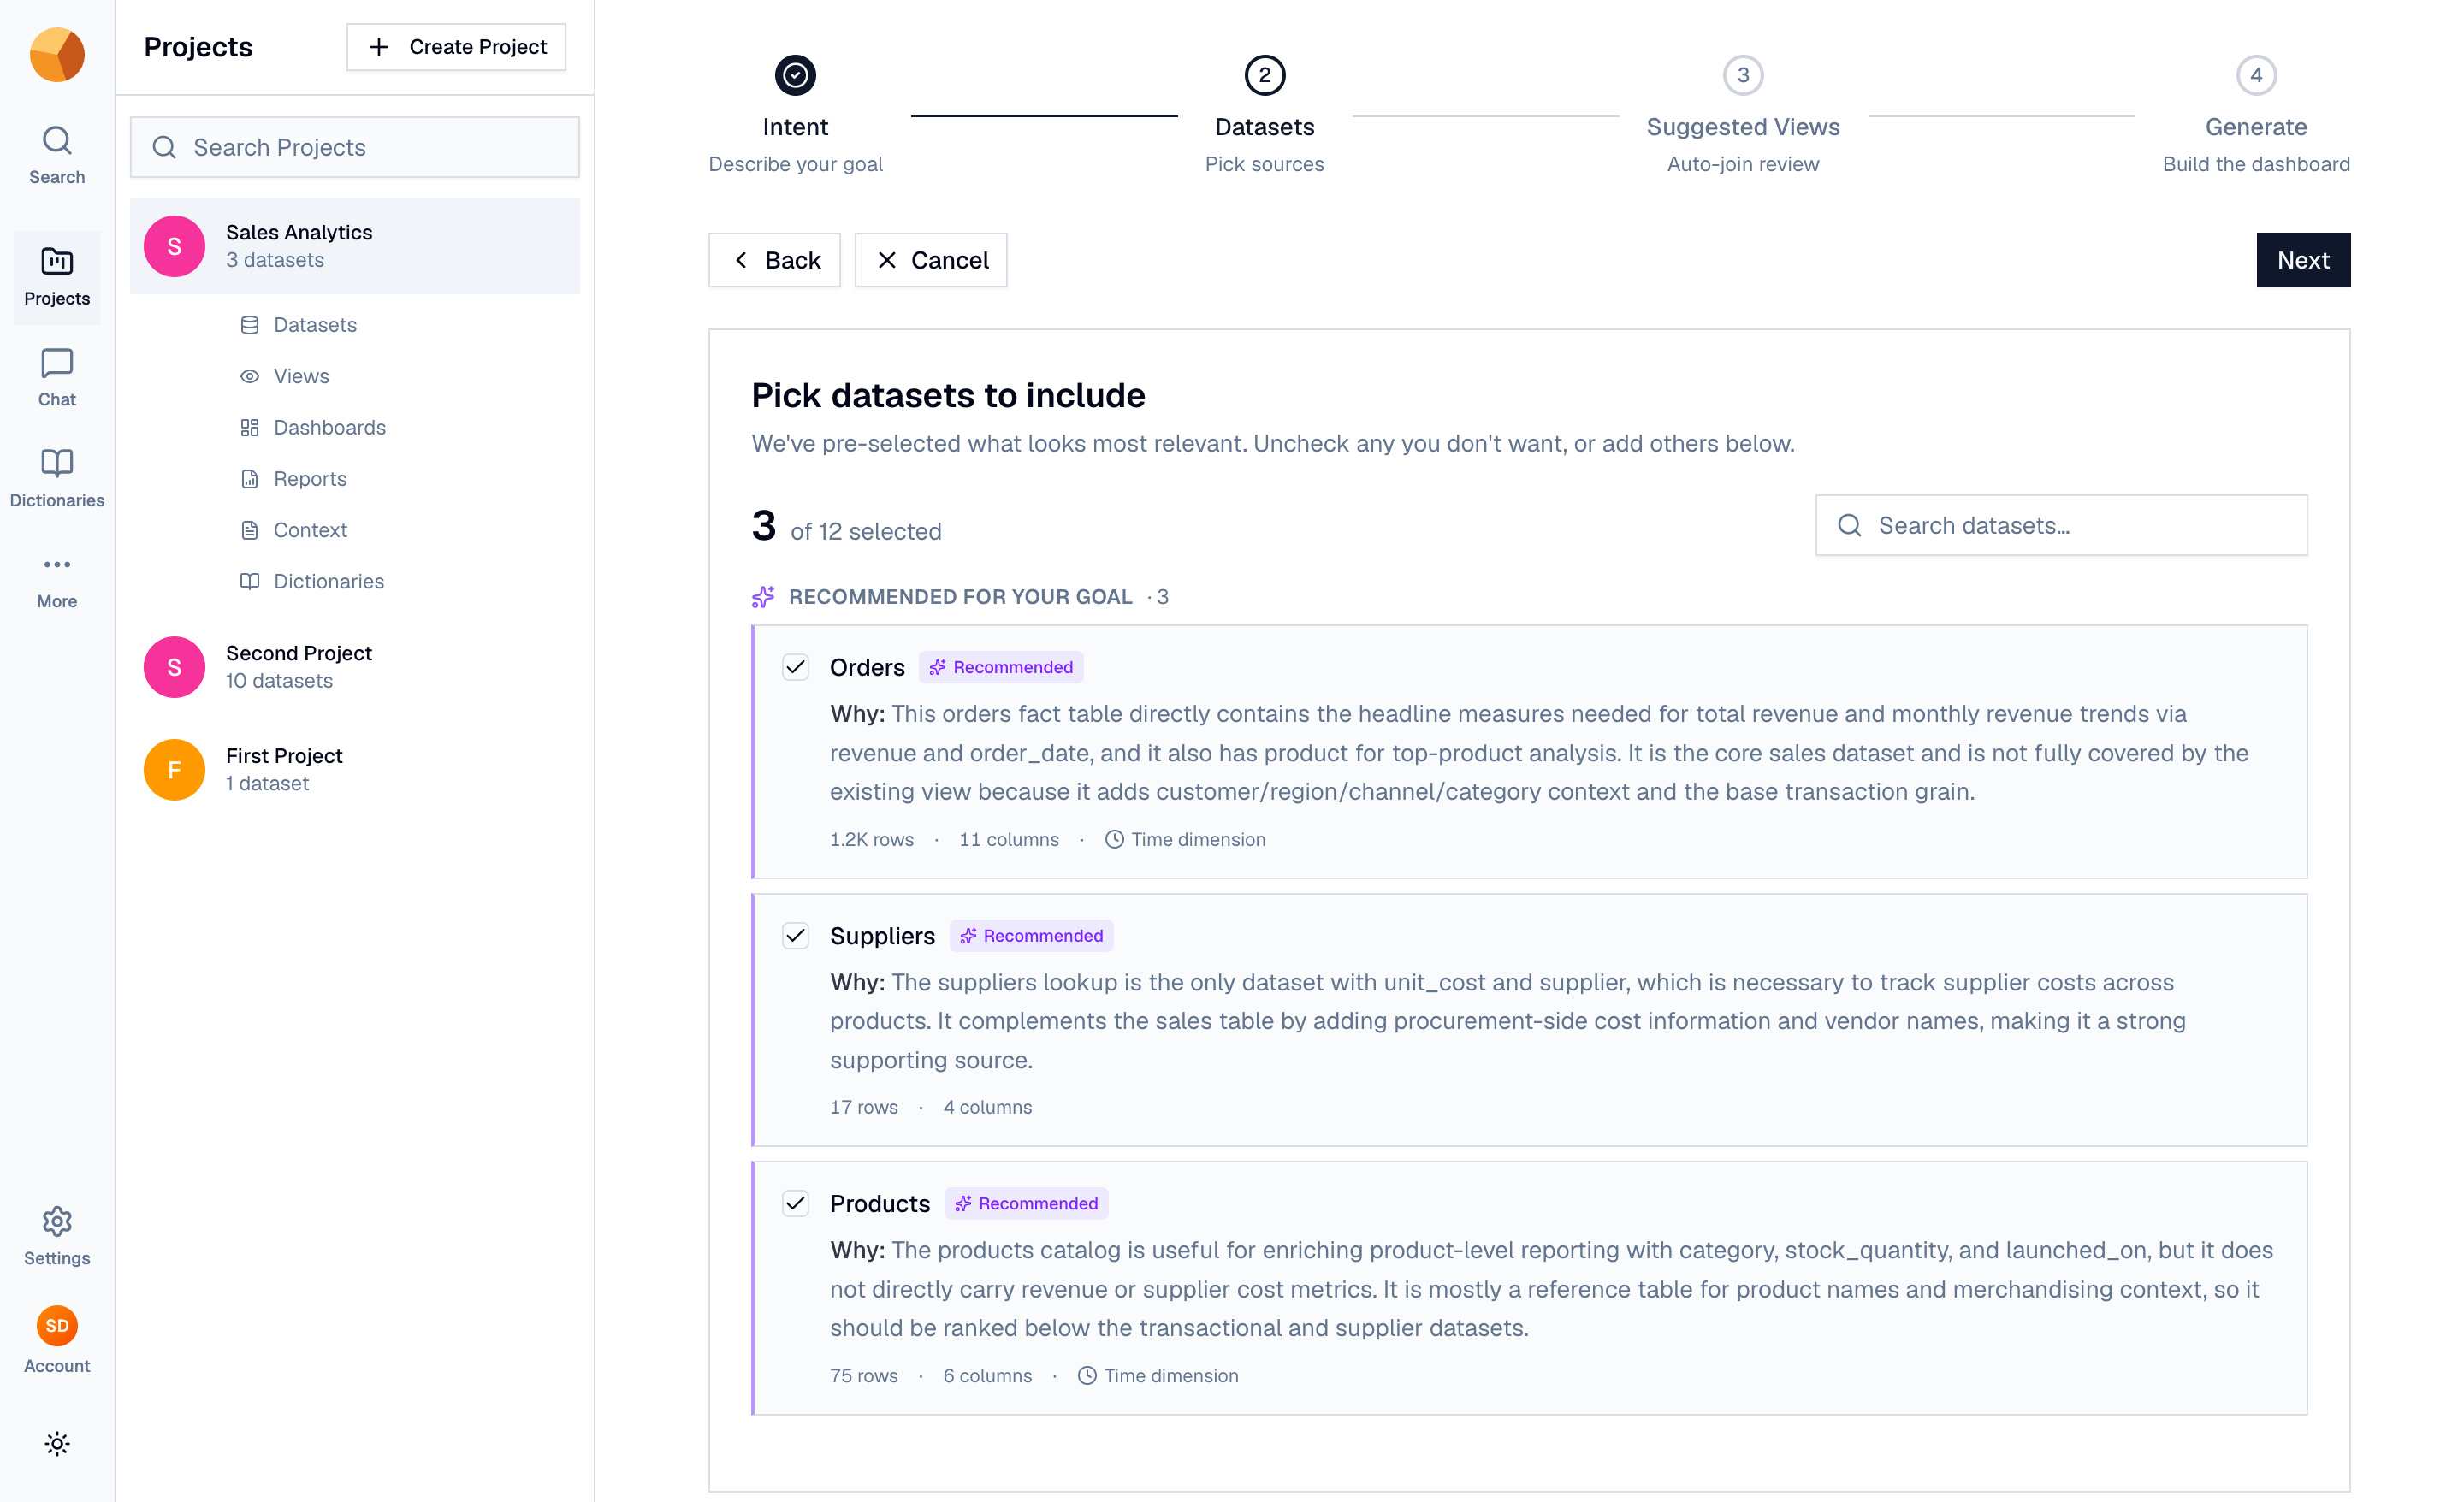
- Intent — describe the goal in a sentence or two ("Track revenue, margin by supplier, and monthly trends"). Suggest from project context drafts one from your project's descriptions.
- Datasets — GoPie profiles the project's datasets and pre-selects the ones Recommended for your goal; adjust the selection freely (dashboards cap the number of sources for performance).
- Suggested Views — where the chosen datasets share join keys, the wizard proposes joined views to power cross-dataset tiles. Inspect each View SQL definition, toggle any off, or Skip all.
- Generate — the same streamed phases as above, then Open Dashboard.
The suggested views are created as real saved views alongside the dashboard, so you can query and reuse them independently.
Regenerate#
Running Generate dashboard again on a dataset or view that already has one asks before overwriting — regeneration replaces the canvas (the old design stays recoverable in version history). Generating the first dashboard is open to anyone who can see the dataset; regenerating an existing one follows the edit rules.
When generation fails#
If generation fails outright, the progress card says so with Try Again and Edit Selections; cancelling mid-run saves nothing and keeps your wizard selections. A stall notice appears if a phase takes unusually long — generation continues in the background either way.